> ## Documentation Index
> Fetch the complete documentation index at: https://portaldocs.peartelco.app/llms.txt
> Use this file to discover all available pages before exploring further.
# Queue Calls
> Calls routed through your queues, filterable by time period and queue
 ## Overview
The Queue Calls card shows how many calls went through a queue for the time period you choose. It also shows how many were answered, how many were abandoned, and the average wait time. If you see a lot of abandoned calls compared to answered ones, it may be worth looking at staffing levels.
## What you'll see
The card shows a summary of queue activity including:
* Total calls answered through queues
* Abandoned calls
* Average wait time
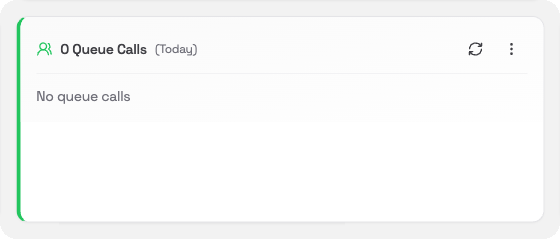
When there have been no queue calls in the period, it shows **No queue calls**.
## Changing the time period
Click the **⋯** menu in the card header to change the period:
* **Today**: calls so far today (default)
* **Yesterday**: the full previous day
* **This Week**: Monday to today
* **Last Week**: the full previous week
## Filtering by queue
If your system has more than one queue, the **⋯** menu also lets you choose which queues to include. Each queue has a checkbox. Tick or untick to include or exclude it. At least one queue must stay selected at all times.
The card header shows how many queues are currently selected (for example, *2 of 3 queues*).
## Refreshing the data
Click the **refresh** icon in the card header to update the counts.
## Overview
The Queue Calls card shows how many calls went through a queue for the time period you choose. It also shows how many were answered, how many were abandoned, and the average wait time. If you see a lot of abandoned calls compared to answered ones, it may be worth looking at staffing levels.
## What you'll see
The card shows a summary of queue activity including:
* Total calls answered through queues
* Abandoned calls
* Average wait time
When there have been no queue calls in the period, it shows **No queue calls**.
## Changing the time period
Click the **⋯** menu in the card header to change the period:
* **Today**: calls so far today (default)
* **Yesterday**: the full previous day
* **This Week**: Monday to today
* **Last Week**: the full previous week
## Filtering by queue
If your system has more than one queue, the **⋯** menu also lets you choose which queues to include. Each queue has a checkbox. Tick or untick to include or exclude it. At least one queue must stay selected at all times.
The card header shows how many queues are currently selected (for example, *2 of 3 queues*).
## Refreshing the data
Click the **refresh** icon in the card header to update the counts.