> ## Documentation Index
> Fetch the complete documentation index at: https://portaldocs.peartelco.app/llms.txt
> Use this file to discover all available pages before exploring further.
# Top Extensions
> See which extensions have handled the most calls, for any time period
 ## Overview
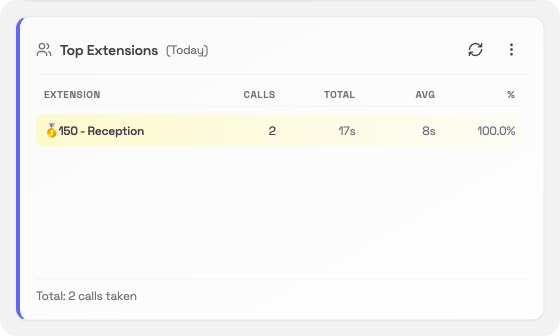
The Top Extensions card lists the extensions on your system in order of how many incoming calls they have taken. It is a quick way to see who is the busiest and how calls are spread across your team.
## What you'll see
Each row in the table shows one extension:
| Column | What it means |
| ------------- | ----------------------------------------- |
| **Extension** | The extension number and name |
| **Calls** | Number of calls handled in the period |
| **Total** | Total talk time across all calls |
| **Avg** | Average call length |
| **%** | This extension's share of all calls taken |
The top three extensions are highlighted with 🥇 🥈 🥉 medals.
## Changing the time period
Click the **⋯** menu in the card header to change the period:
* **Today**: calls so far today (default)
* **Yesterday**: the full previous day
* **This Week**: Monday to today
* **Last Week**: the full previous week
## Refreshing the data
Click the **refresh** icon in the card header to update the rankings.
## Overview
The Top Extensions card lists the extensions on your system in order of how many incoming calls they have taken. It is a quick way to see who is the busiest and how calls are spread across your team.
## What you'll see
Each row in the table shows one extension:
| Column | What it means |
| ------------- | ----------------------------------------- |
| **Extension** | The extension number and name |
| **Calls** | Number of calls handled in the period |
| **Total** | Total talk time across all calls |
| **Avg** | Average call length |
| **%** | This extension's share of all calls taken |
The top three extensions are highlighted with 🥇 🥈 🥉 medals.
## Changing the time period
Click the **⋯** menu in the card header to change the period:
* **Today**: calls so far today (default)
* **Yesterday**: the full previous day
* **This Week**: Monday to today
* **Last Week**: the full previous week
## Refreshing the data
Click the **refresh** icon in the card header to update the rankings.